GIS PORTFOLIO FOR DANE GERTSCH
ABOUT ME
Dane Gertsch
Greetings, I'm Dane Gertsch, a recent graduate with a B.S. in History from Oregon State University and a GIS certificate from Palomar College and Pasadena City College (completed in December 2023). This portfolio showcases my academic journey and practical experiences in the realm of Geographic Information Systems (GIS).
Within these pages, you'll discover examples of my work, crafted both in the classroom and during my pursuits. While this website is still evolving, it provides a glimpse into my proficiency with ArcPy, Python, RStudio, ArcGIS Pro, ArcGIS Online, ArcGIS Collector, QGIS, and Story Maps. Additionally, I have experience with relational databases such as Arc SDE. The courses I've undertaken encompass GIS, Remote Sensing, and GIS Programming with Python.
One notable project involved contributing to GEOINT initiatives like Janus Geography for the National Geospatial-Intelligence Agency (NGA) during my tenure as a GIS Technician at NV5 Geospatial.
Passionate about spatial technology and concepts, I am committed to continuous growth in GIS.
Currently seeking internship or technician opportunities, I am eager to contribute, learn, and elevate my proficiency in GIS technology. Please note that certain map content on this website may require ArcGIS sign-in for access. Thank you for exploring my evolving portfolio!
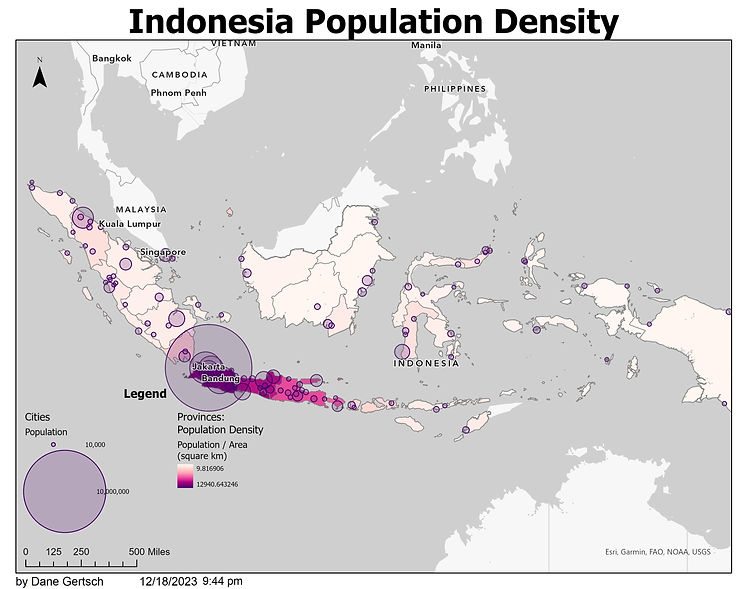
Indonesia Population: Cartographic Design
Within the realm of cartographic design principles, I endeavored to create a map that thoughtfully illustrates Indonesia's population density. The primary focus of this project was to seamlessly integrate design principles that not only meet but enhance the clarity and effectiveness of conveying demographic insights.
Chicago Redlining and Park Equity Project

The Chicago Redlining Project was created by downloading shapefiles from the city of Chicago. The goal was to look for the effects of residential redlining and Park equity.
I analyzed sites 1km or larger in formerly redlined areas and used the polygon feature to create potential equitable park sites.
Syrian Refugee Site Project
The Syrian Refugee Project was completed by finding suitable sites within 100km of the Syrian/Turkey border. The goal was to find areas near the border region with flat land and access to roads. Shapefiles were downloaded and converted from the UN. Several geoprocessing tools were used including, batch, raster to polygon, slope, hillshade, mosiac and buffer.

New Mexico Scripting Project
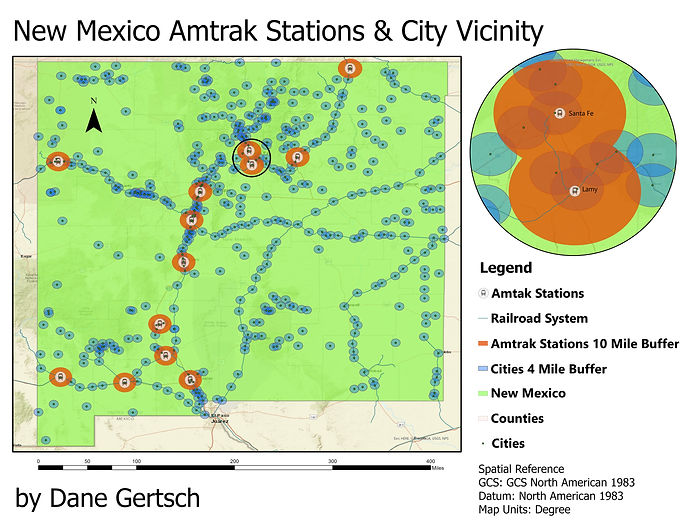
In this project we took infrastructure data from New Mexico. The goals were to create 10 mile buffers on Amtrak Stations, and find cities in the nearby vicinity. I made a script to calculate the nearest cities next to a Amtrak Stations. I manipulated list data, and altered the attribute table. Lastly, I looped over a list of shapefiles and create buffers of varying distance; (2,4,8, and 10 miles). In the legend is two of the loops at 4, and 10 miles.
JUST SUSTAINABILITY PROJECT
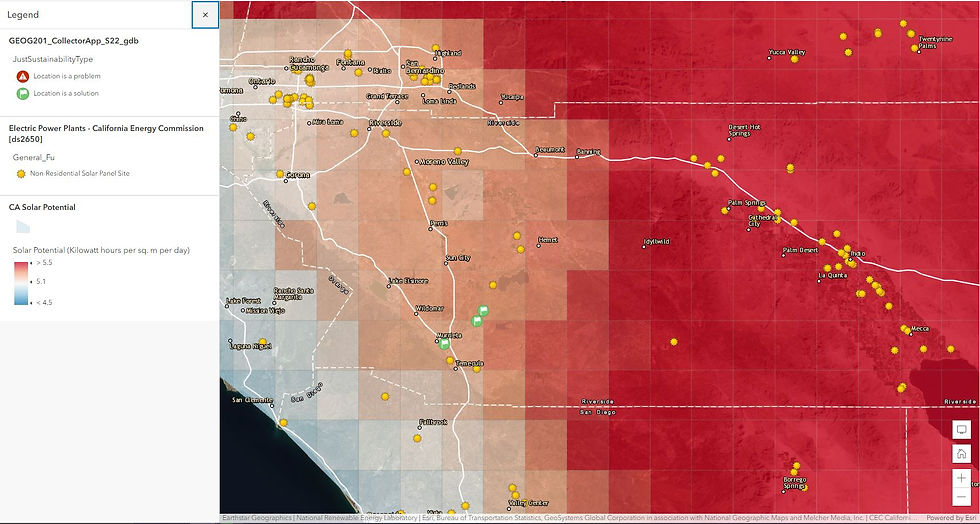
Energy and Food Security in the Inland Empire
A map showing a problem and solution I produced about Heat Islands in my native area of Murrieta, CA. ArcGIS Online, ArcGIS Collector App, and Story Maps were used for this project.
HOSPITAL DRIVE TIME AND COVID 19
Drive time to local hospitals interlaced with demographic data.
Hurricane Katrina Flooding
We used data downloaded from NOAA to analyze rainfall totals created during Hurricane Katrina's storm path in 2005. The relationship between elevation and the storms path would be explored. Various maps were created to showcase vulnerable factors cause by the storm.

Northridge Project (GEOG 360)
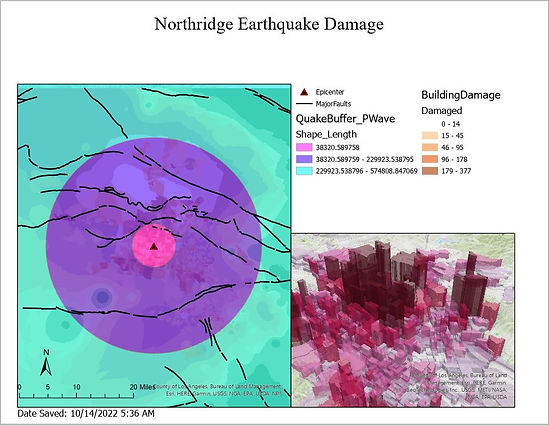
In this project, we downloaded shapefiles about the Northridge Earthquake (1994). Introduction to ArcGIS Pro. Analysis was performed about damage related to the epicenter of the quake.
Just Sustainability Maps (If They Dont Load Above)